

Page | |
Earnings Release | |
Consolidated Statements of Operations | |
Consolidated Balance Sheets | |
Schedule 1 - Funds From Operations and Core Funds From Operations | |
Schedule 2 - Other Non-GAAP Financial Measurements | |
Schedule 3 - Portfolio Summary | |
Schedule 4 - Debt and Equity Capitalization | |
Schedule 5 - Summarized Information for Unconsolidated Real Estate Ventures | |
Schedule 6 - Same Store Performance Summary | |
Schedule 7 - Reconciliation of Same Store Data and Net Operating Income to Net Income | |
Schedule 8 - Selected Financial Information | |
Glossary | |
• | Reported loss per share of $0.16 for the fourth quarter of 2018. |
• | Reported core funds from operations ("Core FFO") of $0.37 per share for the fourth quarter of 2018, an increase of 15.6% compared to the fourth quarter of 2017. |
• | Achieved same store net operating income ("NOI") growth of 5.3% for the fourth quarter of 2018 compared to the same period in 2017, driven by a 4.2% increase in same store total revenues and a 2.0% increase in same store property operating expenses. |
• | Acquired seven wholly-owned self storage properties for $51.4 million during the fourth quarter of 2018. |
• | Reported earnings per share of $0.07 for full year 2018. |
• | Reported Core FFO of $1.38 per share for full year 2018, an increase of 11.3% compared to full year 2017. |
• | Achieved same store NOI growth of 4.7% for full year 2018 compared to full year 2017, driven by a 4.0% increase in same store total revenues and a 2.6% increase in same store property operating expenses. |
• | Acquired 57 wholly-owned self storage properties for $356.6 million and invested in 106 joint venture properties valued at $1.3 billion during full year 2018. |
• | Completed an offering of 5,900,000 common shares resulting in net proceeds of approximately $176 million. |
• | Added Southern Self Storage of Palm Beach Gardens, Florida as NSA’s ninth Participating Regional Operator (“PRO”), with first properties contributed in January 2019. |
• | Entered into definitive agreements to add Moove In Self Storage of York, Pennsylvania as NSA’s tenth PRO. |
• | Acquired 23 wholly-owned self storage properties for approximately $147.0 million. |
($ in thousands, except per share and unit data) | Three Months Ended December 31, | Year Ended December 31, | |||||||||||||||||||
2018 | 2017 | Growth | 2018 | 2017 | Growth | ||||||||||||||||
Net income | $ | 14,483 | $ | 12,015 | 20.5 | % | $ | 56,326 | $ | 45,998 | 22.5 | % | |||||||||
Funds From Operations ("FFO")(1) | $ | 32,201 | $ | 23,482 | 37.1 | % | $ | 116,378 | $ | 90,584 | 28.5 | % | |||||||||
Add back acquisition costs and NSA's share of unconsolidated real estate venture acquisition costs | 192 | 143 | 34.3 | % | 663 | 615 | 7.8 | % | |||||||||||||
Core FFO(1) | $ | 32,393 | $ | 23,625 | 37.1 | % | $ | 117,041 | $ | 91,199 | 28.3 | % | |||||||||
Earnings (loss) per share - basic and diluted | $ | (0.16 | ) | $ | (0.08 | ) | 100.0 | % | $ | 0.07 | $ | 0.01 | 600.0 | % | |||||||
FFO per share and unit(1) | $ | 0.37 | $ | 0.31 | 19.4 | % | $ | 1.37 | $ | 1.23 | 11.4 | % | |||||||||
Core FFO per share and unit(1) | $ | 0.37 | $ | 0.32 | 15.6 | % | $ | 1.38 | $ | 1.24 | 11.3 | % | |||||||||
($ in thousands, except per square foot data) | Three Months Ended December 31, | Year Ended December 31, | |||||||||||||||||||
2018 | 2017 | Growth | 2018 | 2017 | Growth | ||||||||||||||||
Total revenues | $ | 63,951 | $ | 61,356 | 4.2 | % | $ | 251,811 | $ | 242,074 | 4.0 | % | |||||||||
Property operating expenses | 19,878 | 19,484 | 2.0 | % | 79,591 | 77,576 | 2.6 | % | |||||||||||||
Net Operating Income (NOI) | $ | 44,073 | $ | 41,872 | 5.3 | % | $ | 172,220 | $ | 164,498 | 4.7 | % | |||||||||
NOI Margin | 68.9 | % | 68.2 | % | 0.7 | % | 68.4 | % | 68.0 | % | 0.4 | % | |||||||||
Average Occupancy | 88.4 | % | 88.9 | % | (0.5 | )% | 89.0 | % | 89.2 | % | (0.2 | )% | |||||||||
Average Annualized Rental Revenue Per Occupied Square Foot | $ | 12.28 | $ | 11.76 | 4.4 | % | $ | 12.02 | $ | 11.55 | 4.1 | % | |||||||||
Ranges for Full Year 2019 | ||||
Low | High | |||
Core FFO per share(1) | $1.48 | $1.52 | ||
Same store operations (439 stores) | ||||
Total revenue growth | 2.5% | 3.5% | ||
Property operating expenses growth | 2.5% | 3.5% | ||
NOI growth | 2.5% | 3.5% | ||
General and administrative expenses (as a percent of revenue) | 11.0% | 12.0% | ||
General and administrative expenses (excluding equity-based compensation) | 10.0% | 10.5% | ||
Equity-based compensation | 1.0% | 1.5% | ||
Management fees and other revenue, in millions | $20.0 | $21.0 | ||
Core FFO from unconsolidated real estate venture, in millions | $15.0 | $16.0 | ||
Subordinated performance unit distributions, in millions | $32.0 | $34.0 | ||
Wholly-owned acquisitions, in millions | $300.0 | $500.0 | ||
Joint venture acquisitions, in millions | $20.0 | $100.0 | ||
(1) The following table provides a reconciliation of the range of estimated earnings (loss) per share - diluted to estimated Core FFO per share and unit: | |||||||
Ranges for Full Year 2019 | |||||||
Low | High | ||||||
Earnings (loss) per share - diluted | $ | 0.10 | $ | 0.20 | |||
Impact of the difference in weighted average number of shares and GAAP accounting for noncontrolling interests, two-class method and treasury stock method | 0.44 | 0.36 | |||||
Add real estate depreciation and amortization, including NSA's share of unconsolidated venture real estate depreciation and amortization | 1.29 | 1.33 | |||||
FFO attributable to subordinated unitholders | (0.36 | ) | (0.38 | ) | |||
Add acquisition costs and NSA's share of unconsolidated real estate venture acquisition costs | 0.01 | 0.01 | |||||
Core FFO per share and unit | $ | 1.48 | $ | 1.52 | |||
Three Months Ended December 31, | Year Ended December 31, | ||||||||||||||
2018 | 2017 | 2018 | 2017 | ||||||||||||
REVENUE | |||||||||||||||
Rental revenue | $ | 81,826 | $ | 69,101 | $ | 308,403 | $ | 251,814 | |||||||
Other property-related revenue | 2,626 | 2,184 | 10,183 | 8,255 | |||||||||||
Management fees and other revenue | 4,846 | 2,083 | 12,310 | 8,061 | |||||||||||
Total revenue | 89,298 | 73,368 | 330,896 | 268,130 | |||||||||||
OPERATING EXPENSES | |||||||||||||||
Property operating expenses | 26,913 | 23,285 | 103,875 | 84,455 | |||||||||||
General and administrative expenses | 10,606 | 7,994 | 36,220 | 30,060 | |||||||||||
Depreciation and amortization | 22,921 | 20,169 | 89,147 | 75,115 | |||||||||||
Total operating expenses | 60,440 | 51,448 | 229,242 | 189,630 | |||||||||||
Income from operations | 28,858 | 21,920 | 101,654 | 78,500 | |||||||||||
OTHER (EXPENSE) INCOME | |||||||||||||||
Interest expense | (11,961 | ) | (9,280 | ) | (42,724 | ) | (34,068 | ) | |||||||
Equity in losses of unconsolidated real estate ventures | (1,713 | ) | (79 | ) | (1,423 | ) | (2,339 | ) | |||||||
Acquisition costs | (192 | ) | (143 | ) | (663 | ) | (593 | ) | |||||||
Non-operating (expense) income | (160 | ) | 17 | (91 | ) | (58 | ) | ||||||||
(Loss) gain on sale of self storage properties | — | (28 | ) | 391 | 5,715 | ||||||||||
Other expense | (14,026 | ) | (9,513 | ) | (44,510 | ) | (31,343 | ) | |||||||
Income before income taxes | 14,832 | 12,407 | 57,144 | 47,157 | |||||||||||
Income tax expense | (349 | ) | (392 | ) | (818 | ) | (1,159 | ) | |||||||
Net income | 14,483 | 12,015 | 56,326 | 45,998 | |||||||||||
Net income attributable to noncontrolling interests | (21,119 | ) | (13,247 | ) | (42,217 | ) | (43,037 | ) | |||||||
Net (loss) income attributable to National Storage Affiliates Trust | (6,636 | ) | (1,232 | ) | 14,109 | 2,961 | |||||||||
Distributions to preferred shareholders | (2,587 | ) | (2,300 | ) | (10,350 | ) | (2,300 | ) | |||||||
Net (loss) income attributable to common shareholders | $ | (9,223 | ) | $ | (3,532 | ) | $ | 3,759 | $ | 661 | |||||
Earnings (loss) per share - basic and diluted | $ | (0.16 | ) | $ | (0.08 | ) | $ | 0.07 | $ | 0.01 | |||||
Weighted average shares outstanding - basic and diluted | 56,571 | 45,775 | 53,293 | 44,423 | |||||||||||
December 31, | |||||||
2018 | 2017 | ||||||
ASSETS | |||||||
Real estate | |||||||
Self storage properties | $ | 2,637,723 | $ | 2,275,233 | |||
Less accumulated depreciation | (246,261 | ) | (170,358 | ) | |||
Self storage properties, net | 2,391,462 | 2,104,875 | |||||
Cash and cash equivalents | 13,181 | 13,366 | |||||
Restricted cash | 3,182 | 3,041 | |||||
Debt issuance costs, net | 1,260 | 2,185 | |||||
Investment in unconsolidated real estate ventures | 245,125 | 89,093 | |||||
Other assets, net | 75,053 | 52,615 | |||||
Assets held for sale | — | 1,555 | |||||
Total assets | $ | 2,729,263 | $ | 2,266,730 | |||
LIABILITIES AND EQUITY | |||||||
Liabilities | |||||||
Debt financing | $ | 1,278,102 | $ | 958,097 | |||
Accounts payable and accrued liabilities | 33,130 | 24,459 | |||||
Deferred revenue | 15,732 | 12,687 | |||||
Total liabilities | 1,326,964 | 995,243 | |||||
Equity | |||||||
Preferred shares of beneficial interest, par value $0.01 per share. 50,000,000 authorized, 6,900,000 issued and outstanding at December 31, 2018 and 2017, at liquidation preference | 172,500 | 172,500 | |||||
Common shares of beneficial interest, par value $0.01 per share. 250,000,000 shares authorized, 56,654,009 and 50,284,934 shares issued and outstanding at December 31, 2018 and 2017, respectively | 567 | 503 | |||||
Additional paid-in capital | 844,276 | 711,467 | |||||
Distributions in excess of earnings | (114,122 | ) | (55,729 | ) | |||
Accumulated other comprehensive income | 13,618 | 12,282 | |||||
Total shareholders' equity | 916,839 | 841,023 | |||||
Noncontrolling interests | 485,460 | 430,464 | |||||
Total equity | 1,402,299 | 1,271,487 | |||||
Total liabilities and equity | $ | 2,729,263 | $ | 2,266,730 | |||
Supplemental Schedule 1 | |||||||||||||||
Funds From Operations and Core Funds From Operations | |||||||||||||||
(in thousands, except per share and unit amounts) (unaudited) | |||||||||||||||
Reconciliation of Net Income to FFO and Core FFO | |||||||||||||||
Three Months Ended December 31, | Year Ended December 31, | ||||||||||||||
2018 | 2017 | 2018 | 2017 | ||||||||||||
Net income | $ | 14,483 | $ | 12,015 | $ | 56,326 | $ | 45,998 | |||||||
Add (subtract): | |||||||||||||||
Real estate depreciation and amortization | 22,606 | 19,896 | 87,938 | 73,669 | |||||||||||
Company's share of unconsolidated real estate venture real estate depreciation and amortization | 5,524 | 1,464 | 10,233 | 7,296 | |||||||||||
Loss (gain) on sale of self storage properties | — | 28 | (391 | ) | (5,715 | ) | |||||||||
Company's share of unconsolidated real estate venture loss on sale of properties | — | — | 205 | — | |||||||||||
Distributions to preferred shareholders and unitholders | (2,716 | ) | (2,300 | ) | (10,822 | ) | (2,300 | ) | |||||||
FFO attributable to subordinated performance unitholders (1) | (7,696 | ) | (7,621 | ) | (27,111 | ) | (28,364 | ) | |||||||
FFO attributable to common shareholders, OP unitholders, and LTIP unitholders | 32,201 | 23,482 | 116,378 | 90,584 | |||||||||||
Add: | |||||||||||||||
Acquisition costs | 192 | 143 | 663 | 593 | |||||||||||
Company's share of unconsolidated real estate venture acquisition costs | — | — | — | 22 | |||||||||||
Core FFO attributable to common shareholders, OP unitholders, and LTIP unitholders | $ | 32,393 | $ | 23,625 | $ | 117,041 | $ | 91,199 | |||||||
Weighted average shares and units outstanding - FFO and Core FFO:(2) | |||||||||||||||
Weighted average shares outstanding - basic | 56,571 | 45,775 | 53,293 | 44,423 | |||||||||||
Weighted average restricted common shares outstanding | 28 | 27 | 29 | 25 | |||||||||||
Weighted average OP units outstanding | 28,881 | 26,549 | 28,977 | 26,126 | |||||||||||
Weighted average DownREIT OP unit equivalents outstanding | 1,835 | 1,835 | 1,835 | 1,835 | |||||||||||
Weighted average LTIP units outstanding | 708 | 547 | 694 | 957 | |||||||||||
Total weighted average shares and units outstanding - FFO and Core FFO | 88,023 | 74,733 | 84,828 | 73,366 | |||||||||||
FFO per share and unit | $ | 0.37 | $ | 0.31 | $ | 1.37 | $ | 1.23 | |||||||
Core FFO per share and unit | $ | 0.37 | $ | 0.32 | $ | 1.38 | $ | 1.24 | |||||||
(1) Amounts represent distributions declared for subordinated performance unitholders and DownREIT subordinated performance unitholders for the periods presented. | |||||||||||||||
(2) NSA combines OP units and DownREIT OP units with common shares because, after the applicable lock-out periods, OP units in the Company's operating partnership are redeemable for cash or, at NSA's option, exchangeable for common shares on a one-for-one basis and DownREIT OP units are also redeemable for cash or, at NSA's option, exchangeable for OP units in the Company's operating partnership on a one-for-one basis, subject to certain adjustments in each case. Subordinated performance units, DownREIT subordinated performance units, and LTIP units may also, under certain circumstances, be convertible into or exchangeable for common shares (or other units that are convertible into or exchangeable for common shares). See footnote(3) for additional discussion of subordinated performance units, DownREIT subordinated performance units, and LTIP units in the calculation of FFO and Core FFO per share and unit. | |||||||||||||||
Supplemental Schedule 1 (continued) | |||||||||||||||
Funds From Operations and Core Funds From Operations | |||||||||||||||
(in thousands, except per share and unit amounts) (unaudited) | |||||||||||||||
Reconciliation of Earnings (Loss) Per Share - Diluted to FFO and Core FFO Per Share and Unit | |||||||||||||||
Three Months Ended December 31, | Year Ended December 31, | ||||||||||||||
2018 | 2017 | 2018 | 2017 | ||||||||||||
Earnings (loss) per share - diluted | $ | (0.16 | ) | $ | (0.08 | ) | $ | 0.07 | $ | 0.01 | |||||
Impact of the difference in weighted average number of shares(3) | 0.06 | 0.02 | (0.03 | ) | — | ||||||||||
Impact of GAAP accounting for noncontrolling interests, two-class method and treasury stock method(4) | 0.24 | 0.18 | 0.49 | 0.59 | |||||||||||
Add real estate depreciation and amortization | 0.26 | 0.27 | 1.04 | 1.00 | |||||||||||
Add Company's share of unconsolidated real estate venture real estate depreciation and amortization | 0.06 | 0.02 | 0.12 | 0.10 | |||||||||||
Subtract gain on sale of self storage properties | — | — | — | (0.08 | ) | ||||||||||
FFO attributable to subordinated performance unitholders | (0.09 | ) | (0.10 | ) | (0.32 | ) | (0.39 | ) | |||||||
FFO per share and unit | 0.37 | 0.31 | 1.37 | 1.23 | |||||||||||
Add acquisition costs and Company's share of unconsolidated real estate venture acquisition costs | — | 0.01 | 0.01 | 0.01 | |||||||||||
Core FFO per share and unit | $ | 0.37 | $ | 0.32 | $ | 1.38 | $ | 1.24 | |||||||
(3) Adjustment accounts for the difference between the weighted average number of shares used to calculate diluted earnings per share and the weighted average number of shares used to calculate FFO and Core FFO per share and unit. Diluted earnings per share is calculated using the two-class method for the company's restricted common shares and the treasury stock method for certain unvested LTIP units, and assumes the conversion of vested LTIP units into OP units on a one-for-one basis and the hypothetical conversion of subordinated performance units, and DownREIT subordinated performance units into OP units, even though such units may only be convertible into OP units (i) after a lock-out period and (ii) upon certain events or conditions. For additional information about the conversion of subordinated performance units and DownREIT subordinated performance units into OP units, see Note 10 to the Company's most recent Annual Report on Form 10-K, filed with the Securities and Exchange Commission. The computation of weighted average shares and units for FFO and Core FFO per share and unit includes all restricted common shares and LTIP units that participate in distributions and excludes all subordinated performance units and DownREIT subordinated performance units because their effect has been accounted for through the allocation of FFO to the related unitholders based on distributions declared. | |||||||||||||||
(4) Represents the effect of adjusting the numerator to consolidated net income (loss) prior to GAAP allocations for noncontrolling interests, after deducting preferred share and unit distributions, and before the application of the two-class method and treasury stock method, as described in footnote(3). | |||||||||||||||
Supplemental Schedule 2 | |||||||||||||||
Other Non-GAAP Financial Measurements | |||||||||||||||
(dollars in thousands) (unaudited) | |||||||||||||||
Net Operating Income | |||||||||||||||
Three Months Ended December 31, | Year Ended December 31, | ||||||||||||||
2018 | 2017 | 2018 | 2017 | ||||||||||||
Net income | $ | 14,483 | $ | 12,015 | $ | 56,326 | $ | 45,998 | |||||||
(Subtract) add: | |||||||||||||||
Management fees and other revenue | (4,846 | ) | (2,083 | ) | (12,310 | ) | (8,061 | ) | |||||||
General and administrative expenses | 10,606 | 7,994 | 36,220 | 30,060 | |||||||||||
Depreciation and amortization | 22,921 | 20,169 | 89,147 | 75,115 | |||||||||||
Interest expense | 11,961 | 9,280 | 42,724 | 34,068 | |||||||||||
Equity in losses of unconsolidated real estate ventures | 1,713 | 79 | 1,423 | 2,339 | |||||||||||
Acquisition costs | 192 | 143 | 663 | 593 | |||||||||||
Income tax expense | 349 | 392 | 818 | 1,159 | |||||||||||
Loss (gain) on sale of self storage properties | — | 28 | (391 | ) | (5,715 | ) | |||||||||
Non-operating expense (income) | 160 | (17 | ) | 91 | 58 | ||||||||||
Net Operating Income | $ | 57,539 | $ | 48,000 | $ | 214,711 | $ | 175,614 | |||||||
EBITDA and Adjusted EBITDA | |||||||||||||||
Three Months Ended December 31, | Year Ended December 31, | ||||||||||||||
2018 | 2017 | 2018 | 2017 | ||||||||||||
Net income | $ | 14,483 | $ | 12,015 | $ | 56,326 | $ | 45,998 | |||||||
Add: | |||||||||||||||
Depreciation and amortization | 22,921 | 20,169 | 89,147 | 75,115 | |||||||||||
Company's share of unconsolidated real estate venture depreciation and amortization | 5,524 | 1,464 | 10,233 | 7,296 | |||||||||||
Interest expense | 11,961 | 9,280 | 42,724 | 34,068 | |||||||||||
Income tax expense | 349 | 392 | 818 | 1,159 | |||||||||||
EBITDA | 55,238 | 43,320 | 199,248 | 163,636 | |||||||||||
Add (subtract): | |||||||||||||||
Acquisition costs | 192 | 143 | 663 | 593 | |||||||||||
Company's share of unconsolidated real estate venture acquisition costs | — | — | — | 22 | |||||||||||
Loss (gain) on sale of self storage properties | — | 28 | (391 | ) | (5,715 | ) | |||||||||
Company's share of unconsolidated real estate venture loss on sale of properties | — | — | 205 | — | |||||||||||
Equity-based compensation expense | 1,029 | 920 | 3,837 | 3,764 | |||||||||||
Adjusted EBITDA | $ | 56,459 | $ | 44,411 | $ | 203,562 | $ | 162,300 | |||||||
Supplemental Schedule 3 | ||||||||||||||||||||||||||
Portfolio Summary | ||||||||||||||||||||||||||
As of December 31, 2018 | ||||||||||||||||||||||||||
(dollars in thousands) (unaudited) | ||||||||||||||||||||||||||
Total Owned Store Data by State | Total Operated Store Data by State | |||||||||||||||||||||||||
State/Territories | Stores | Units | Rentable Square Feet | Occupancy at Period End | State/Territories | Stores | Units | Rentable Square Feet | Occupancy at Period End | |||||||||||||||||
California | 83 | 49,569 | 6,226,522 | 89.2 | % | California | 93 | 55,770 | 6,980,522 | 89.2 | % | |||||||||||||||
Texas | 60 | 24,150 | 3,417,208 | 88.0 | % | Texas | 64 | 26,462 | 3,680,357 | 87.5 | % | |||||||||||||||
Oregon | 60 | 24,298 | 3,076,899 | 82.5 | % | Florida | 61 | 38,586 | 4,071,545 | 85.6 | % | |||||||||||||||
Georgia | 34 | 14,062 | 1,897,977 | 87.0 | % | Oregon | 60 | 24,298 | 3,076,899 | 82.5 | % | |||||||||||||||
Florida | 34 | 23,490 | 2,355,949 | 86.1 | % | Georgia | 45 | 20,211 | 2,770,284 | 87.7 | % | |||||||||||||||
North Carolina | 33 | 15,394 | 1,885,559 | 91.8 | % | Oklahoma | 36 | 16,118 | 2,196,699 | 85.1 | % | |||||||||||||||
Oklahoma | 30 | 13,875 | 1,902,947 | 85.1 | % | North Carolina | 33 | 15,394 | 1,885,559 | 91.8 | % | |||||||||||||||
Arizona | 29 | 16,062 | 1,825,563 | 85.9 | % | Arizona | 31 | 17,071 | 1,935,393 | 85.9 | % | |||||||||||||||
Indiana | 16 | 8,790 | 1,135,080 | 88.8 | % | Michigan | 24 | 15,483 | 1,963,048 | 87.5 | % | |||||||||||||||
Kansas | 16 | 5,737 | 762,949 | 82.8 | % | Ohio | 22 | 12,350 | 1,518,414 | 88.0 | % | |||||||||||||||
Washington | 15 | 4,950 | 623,996 | 83.9 | % | Nevada | 17 | 8,225 | 1,088,893 | 90.6 | % | |||||||||||||||
Louisiana | 14 | 6,323 | 858,719 | 83.0 | % | Indiana | 16 | 8,790 | 1,135,080 | 88.8 | % | |||||||||||||||
Nevada | 13 | 6,606 | 836,616 | 91.8 | % | Kansas | 16 | 5,737 | 762,949 | 82.8 | % | |||||||||||||||
Colorado | 11 | 5,054 | 615,463 | 86.8 | % | Alabama | 15 | 6,335 | 940,652 | 88.3 | % | |||||||||||||||
New Hampshire | 10 | 4,186 | 509,720 | 92.7 | % | Washington | 15 | 4,950 | 623,996 | 83.9 | % | |||||||||||||||
Ohio | 8 | 3,572 | 454,168 | 88.9 | % | New Jersey | 15 | 10,519 | 1,225,270 | 89.8 | % | |||||||||||||||
Other(1) | 33 | 16,371 | 1,980,228 | 85.9 | % | Louisiana | 14 | 6,323 | 858,719 | 83.0 | % | |||||||||||||||
Total | 499 | 242,489 | 30,365,563 | 87.1 | % | Colorado | 11 | 5,054 | 615,463 | 86.8 | % | |||||||||||||||
New Hampshire | 10 | 4,186 | 509,720 | 92.7 | % | |||||||||||||||||||||
Other(2) | 77 | 43,601 | 5,141,227 | 84.9 | % | |||||||||||||||||||||
Total | 675 | 345,463 | 42,980,689 | 87.0 | % | |||||||||||||||||||||
(1) Other states and territories in NSA's owned portfolio as of December 31, 2018 include Alabama, Illinois, Kentucky, Maryland, Massachusetts, Mississippi, Missouri, New Mexico, South Carolina, Virginia and Puerto Rico. | ||||||
(2) Other states and territories in NSA's operated portfolio as of December 31, 2018 include Delaware, Illinois, Kentucky, Maryland, Massachusetts, Minnesota, Mississippi, Missouri, New Mexico, New York, Pennsylvania, Rhode Island, South Carolina, Tennessee, Virginia and Puerto Rico. | ||||||
Supplemental Schedule 3 (continued) | |||||||||||||||||||||||||||
Portfolio Summary | |||||||||||||||||||||||||||
(dollars in thousands) (unaudited) | |||||||||||||||||||||||||||
2018 Acquisition & Investment Activity | |||||||||||||||||||||||||||
Self Storage Properties Acquired During the Quarter Ended: | Summary of Investment | ||||||||||||||||||||||||||
Stores | Units | Rentable Square Feet | Cash and Acquisition Costs | Value of OP Equity | Mortgages Assumed | Other Liabilities | Total | ||||||||||||||||||||
March 31, 2018 | 25 | 12,002 | 1,352,592 | $ | 105,135 | $ | 22,403 | $ | 7,581 | $ | 670 | $ | 135,789 | ||||||||||||||
June 30, 2018 | 12 | 4,485 | 544,466 | 62,470 | — | — | 467 | 62,937 | |||||||||||||||||||
September 30, 2018 | 13 | 8,410 | 906,220 | 102,012 | 3,660 | — | 856 | 106,528 | |||||||||||||||||||
December 31, 2018 | 7 | 3,263 | 408,485 | 49,221 | 2,000 | — | 174 | 51,395 | |||||||||||||||||||
Total Acquisitions(3) | 57 | 28,160 | 3,211,763 | $ | 318,838 | $ | 28,063 | $ | 7,581 | $ | 2,167 | $ | 356,649 | ||||||||||||||
Unconsolidated Real Estate Ventures (at 100%)(4) | |||||||||||||||||||||||||||
March 31, 2018 | 1 | 481 | 64,745 | 9,394 | — | — | 66 | 9,460 | |||||||||||||||||||
September 30, 2018 | 105 | 63,457 | 7,729,273 | 1,278,312 | — | — | 7,028 | 1,285,340 | |||||||||||||||||||
Total Investments(4) | 163 | 92,098 | 11,005,781 | $ | 1,606,544 | $ | 28,063 | $ | 7,581 | $ | 9,261 | $ | 1,651,449 | ||||||||||||||
2018 Disposition & Divestiture Activity | ||||||||||||
Dispositions Closed During the Quarter Ended: | Stores | Units | Rentable Square Feet | Gross Proceeds | ||||||||
March 31, 2018 | 1 | 327 | 44,689 | $ | 2,200 | |||||||
June 30, 2018 | 1 | 1,152 | 56,000 | 3,300 | ||||||||
Total Dispositions(5) | 2 | 1,479 | 100,689 | $ | 5,500 | |||||||
Unconsolidated Real Estate Ventures (at 100%)(4) | ||||||||||||
September 30, 2018 | 1 | 777 | 195,400 | 9,250 | ||||||||
Total 2018 Divestitures(4) | 3 | 2,256 | 296,089 | $ | 14,750 | |||||||
(3) NSA acquired self storage properties located in Arizona, California, Florida, Georgia, Kansas, Maryland, Missouri, Nevada, North Carolina, Ohio, Oregon, Puerto Rico, Texas and Washington during 2018. | ||||||
(4) Values represent entire unconsolidated real estate ventures at 100%, not NSA's proportionate share. NSA's ownership in each of the unconsolidated real estate ventures is 25%. | ||||||
(5) NSA disposed of self storage properties located in Florida and Washington during 2018. | ||||||
Supplemental Schedule 4 | |||||||
Debt and Equity Capitalization | |||||||
As of December 31, 2018 | |||||||
(unaudited) | |||||||
Debt Balances and Characteristics (dollars in thousands) | |||||||
Effective Interest Rate(1) | Weighted Average Maturity (In Years) | Balance | |||||
Credit Facility: | |||||||
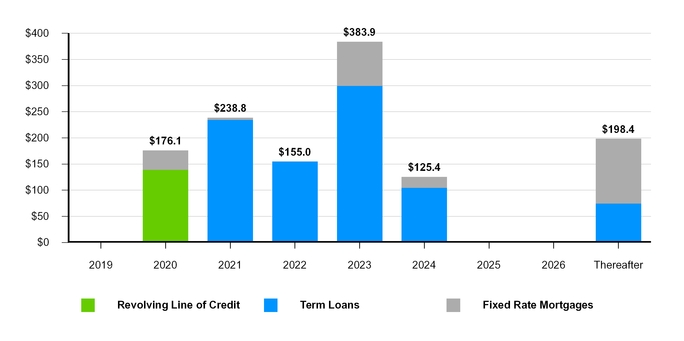
Revolving line of credit | 3.90% | 1.35 | $ | 139,500 | |||
Term loan - Tranche A | 2.91% | 2.35 | 235,000 | ||||
Term loan - Tranche B | 2.94% | 3.35 | 155,000 | ||||
Term loan - Tranche C | 3.71% | 5.09 | 105,000 | ||||
Term loan - Tranche D | 3.79% | 4.08 | 125,000 | ||||
Term loan facility - 2023 | 3.13% | 4.50 | 175,000 | ||||
Term loan facility - 2028 | 4.62% | 10.00 | 75,000 | ||||
Fixed rate mortgages payable | 4.18% | 6.76 | 268,138 | ||||
Total Principal/Weighted Average | 3.58% | 4.44 | 1,277,638 | ||||
Unamortized debt issuance costs and debt premium, net | 464 | ||||||
Total Debt | $ | 1,278,102 | |||||
Debt Maturities (dollars in millions) | |||||
Debt Ratios | |||||
Covenant | Amount | ||||
Net Debt to Annualized Current Quarter Adjusted EBITDA | n/a | 5.6x | |||
Trailing Twelve Month Fixed Charge Coverage Ratio | > 1.5x | 3.2x | |||
Total Leverage Ratio | < 60.0% | 42.7% | |||
(1) Effective interest rate incorporates the stated rate plus the impact of interest rate cash flow hedges and discount and premium amortization, if applicable. For the revolving line of credit, the effective interest rate excludes fees which range from 0.15% to 0.25% for unused borrowings. | |||||
Supplemental Schedule 4 (continued) | |||||
Debt and Equity Capitalization | |||||
As of December 31, 2018 | |||||
(unaudited) | |||||
Preferred Shares and Units | |||||
Outstanding | |||||
6.000% Series A perpetual preferred shares of beneficial interest | 6,900,000 | ||||
6.000% Series A-1 cumulative redeemable preferred units | 343,719 | ||||
Common Shares and Units | |||||
Outstanding | If Converted | ||||
Common shares of beneficial interest | 56,626,127 | 56,626,127 | |||
Restricted common shares | 27,882 | 27,882 | |||
Total shares outstanding | 56,654,009 | 56,654,009 | |||
Operating partnership units | 28,874,103 | 28,874,103 | |||
DownREIT operating partnership unit equivalents | 1,834,786 | 1,834,786 | |||
Total operating partnership units | 30,708,889 | 30,708,889 | |||
Long-term incentive plan units(2) | 707,671 | 707,671 | |||
Total shares and Class A equivalents outstanding | 88,070,569 | 88,070,569 | |||
Subordinated performance units(3) | 10,749,475 | 14,189,307 | |||
DownREIT subordinated performance unit equivalents(3) | 4,386,999 | 5,790,839 | |||
Total subordinated partnership units | 15,136,474 | 19,980,146 | |||
Total common shares and units outstanding | 103,207,043 | 108,050,715 | |||
(2) Balances exclude 224,000 long-term incentive plan ("LTIP") units which only vest and participate in dividend distributions upon the future contribution of properties from the PROs. | |||
(3) If converted balance assumes that each subordinated performance unit (including each DownREIT subordinated performance unit) is convertible into OP units, notwithstanding the two-year lock-out period on conversions for certain series of subordinated performance units, and that each subordinated performance unit would on average convert on a hypothetical basis into an estimated 1.32 OP units based on historical financial information for the trailing twelve months ended December 31, 2018. The hypothetical conversions are calculated by dividing the average cash available for distribution, or CAD, per subordinated performance unit by 110% of the CAD per OP unit over the same period. The Company anticipates that as CAD grows over time, the conversion ratio will also grow, including to levels that may exceed these amounts. | |||
Supplemental Schedule 5 | ||||||||
Summarized Information for Unconsolidated Real Estate Ventures | ||||||||
(dollars in thousands) (unaudited) | ||||||||
Combined Balance Sheet Information | ||||||||
Total Venture at 100%(1) | December 31, 2018 | December 31, 2017 | ||||||
ASSETS | ||||||||
Self storage properties, net | $ | 1,894,412 | $ | 655,973 | ||||
Other assets | 50,915 | 8,397 | ||||||
Total assets | $ | 1,945,327 | $ | 664,370 | ||||
LIABILITIES AND EQUITY | ||||||||
Debt financing | $ | 956,357 | $ | 317,359 | ||||
Other liabilities | 16,516 | 4,855 | ||||||
Equity | 972,454 | 342,156 | ||||||
Total liabilities and equity | $ | 1,945,327 | $ | 664,370 | ||||
Combined Operating Information | ||||||||
Three Months Ended December 31, 2018 | ||||||||
Total Venture at 100%(1) | NSA Proportionate Share (Venture at 25%)(2) | |||||||
Total revenue | $ | 41,415 | $ | 10,354 | ||||
Property operating expenses | 13,170 | 3,293 | ||||||
Net operating income | 28,245 | 7,061 | ||||||
Supervisory, administrative and other expenses | (2,674 | ) | (669 | ) | ||||
Depreciation and amortization | (22,095 | ) | (5,524 | ) | ||||
Interest expense | (10,055 | ) | (2,514 | ) | ||||
Acquisition and other expenses | (344 | ) | (86 | ) | ||||
Net loss | $ | (6,923 | ) | $ | (1,732 | ) | ||
Add (subtract): | ||||||||
Company's share of unconsolidated real estate venture real estate depreciation and amortization | 5,524 | |||||||
Company's share of FFO and Core FFO from unconsolidated real estate ventures | $ | 3,792 | ||||||
(1) Values represent entire unconsolidated real estate venture at 100%, not NSA's proportionate share. NSA's ownership in the unconsolidated real estate venture is 25%. | |||||||
(2) NSA's proportionate share of its unconsolidated real estate venture is derived by applying NSA's 25% ownership interest to each line item in the GAAP financial statements of the unconsolidated real estate venture to calculate NSA's share of that line item. NSA believes this information offers insights into the financial performance of the Company, although the presentation of such information, and its combination with NSA's consolidated results, may not accurately depict the legal and economic implications of holding a noncontrolling interest in the unconsolidated real estate venture. The operating agreement of the unconsolidated real estate venture provides for the distribution of net cash flow to the unconsolidated real estate venture’s investors no less than monthly, generally in proportion to the investors’ respective ownership interests, subject to a promoted distribution to NSA upon the achievement of certain performance benchmarks by the non-NSA investor. | |||||||
Supplemental Schedule 6 | ||||||||||||||||||||||||||||||||||||||||||||
Same Store Performance Summary | ||||||||||||||||||||||||||||||||||||||||||||
(dollars in thousands, except per square foot data) (unaudited) | ||||||||||||||||||||||||||||||||||||||||||||
Three Months Ended December 31, 2018 compared to Three Months Ended December 31, 2017 | ||||||||||||||||||||||||||||||||||||||||||||
Total Revenue | Property Operating Expenses | Net Operating Income | Net Operating Income Margin | |||||||||||||||||||||||||||||||||||||||||
State | Stores | 4Q 2018 | 4Q 2017 | Growth | 4Q 2018 | 4Q 2017 | Growth | 4Q 2018 | 4Q 2017 | Growth | 4Q 2018 | 4Q 2017 | Growth | |||||||||||||||||||||||||||||||
California | 77 | $ | 18,701 | $ | 17,528 | 6.7 | % | $ | 5,383 | $ | 5,176 | 4.0 | % | $ | 13,318 | $ | 12,352 | 7.8 | % | 71.2 | % | 70.5 | % | 0.7 | % | |||||||||||||||||||
Oregon | 55 | 9,140 | 9,172 | (0.3 | )% | 2,429 | 2,424 | 0.2 | % | 6,711 | 6,748 | (0.5 | )% | 73.4 | % | 73.6 | % | (0.2 | )% | |||||||||||||||||||||||||
Texas | 51 | 6,404 | 6,158 | 4.0 | % | 2,273 | 2,363 | (3.8 | )% | 4,131 | 3,795 | 8.9 | % | 64.5 | % | 61.6 | % | 2.9 | % | |||||||||||||||||||||||||
Oklahoma | 30 | 3,749 | 3,672 | 2.1 | % | 1,180 | 1,208 | (2.3 | )% | 2,569 | 2,464 | 4.3 | % | 68.5 | % | 67.1 | % | 1.4 | % | |||||||||||||||||||||||||
North Carolina | 28 | 4,016 | 3,845 | 4.4 | % | 1,470 | 1,149 | 27.9 | % | 2,546 | 2,696 | (5.6 | )% | 63.4 | % | 70.1 | % | (6.7 | )% | |||||||||||||||||||||||||
Florida | 20 | 5,035 | 4,879 | 3.2 | % | 1,507 | 1,537 | (2.0 | )% | 3,528 | 3,342 | 5.6 | % | 70.1 | % | 68.5 | % | 1.6 | % | |||||||||||||||||||||||||
Georgia | 20 | 2,063 | 1,938 | 6.4 | % | 760 | 701 | 8.4 | % | 1,303 | 1,237 | 5.3 | % | 63.2 | % | 63.8 | % | (0.6 | )% | |||||||||||||||||||||||||
Arizona | 15 | 3,074 | 2,944 | 4.4 | % | 874 | 880 | (0.7 | )% | 2,200 | 2,064 | 6.6 | % | 71.6 | % | 70.1 | % | 1.5 | % | |||||||||||||||||||||||||
Indiana | 14 | 2,230 | 2,066 | 7.9 | % | 744 | 754 | (1.3 | )% | 1,486 | 1,312 | 13.3 | % | 66.6 | % | 63.5 | % | 3.1 | % | |||||||||||||||||||||||||
Washington | 13 | 1,812 | 1,790 | 1.2 | % | 519 | 525 | (1.1 | )% | 1,293 | 1,265 | 2.2 | % | 71.4 | % | 70.7 | % | 0.7 | % | |||||||||||||||||||||||||
Colorado | 10 | 1,668 | 1,629 | 2.4 | % | 532 | 522 | 1.9 | % | 1,136 | 1,107 | 2.6 | % | 68.1 | % | 68.0 | % | 0.1 | % | |||||||||||||||||||||||||
Louisiana | 10 | 1,433 | 1,429 | 0.3 | % | 490 | 408 | 20.1 | % | 943 | 1,021 | (7.6 | )% | 65.8 | % | 71.4 | % | (5.6 | )% | |||||||||||||||||||||||||
Other(1) | 33 | 4,626 | 4,306 | 7.4 | % | 1,717 | 1,837 | (6.5 | )% | 2,909 | 2,469 | 17.8 | % | 62.9 | % | 57.3 | % | 5.6 | % | |||||||||||||||||||||||||
Total/Weighted Average | 376 | $ | 63,951 | $ | 61,356 | 4.2 | % | $ | 19,878 | $ | 19,484 | 2.0 | % | $ | 44,073 | $ | 41,872 | 5.3 | % | 68.9 | % | 68.2 | % | 0.7 | % | |||||||||||||||||||
(1) Other states in NSA's same store portfolio include Alabama, Kentucky, Mississippi, Nevada, New Hampshire, New Mexico, Ohio and South Carolina. | ||||||
Supplemental Schedule 6 (continued) | |||||||||||||||||||||||||||||||||
Same Store Performance Summary | |||||||||||||||||||||||||||||||||
(dollars in thousands, except per square foot data) (unaudited) | |||||||||||||||||||||||||||||||||
Three Months Ended December 31, 2018 compared to Three Months Ended December 31, 2017 | |||||||||||||||||||||||||||||||||
Rentable Square Feet | Occupancy at Period End | Average Occupancy | Average Annualized Rental Revenue per Occupied Square Foot | ||||||||||||||||||||||||||||||
State | Units | 4Q 2018 | 4Q 2017 | Growth | 4Q 2018 | 4Q 2017 | Growth | 4Q 2018 | 4Q 2017 | Growth | |||||||||||||||||||||||
California | 46,480 | 5,819,811 | 89.1 | % | 90.8 | % | (1.7 | )% | 89.7 | % | 91.3 | % | (1.6 | )% | $ | 13.72 | $ | 12.59 | 9.0 | % | |||||||||||||
Oregon | 22,480 | 2,834,113 | 82.6 | % | 85.9 | % | (3.3 | )% | 84.2 | % | 87.4 | % | (3.2 | )% | 15.02 | 14.59 | 2.9 | % | |||||||||||||||
Texas | 19,966 | 2,819,416 | 88.4 | % | 88.5 | % | (0.1 | )% | 89.0 | % | 88.7 | % | 0.3 | % | 9.95 | 9.62 | 3.4 | % | |||||||||||||||
Oklahoma | 13,875 | 1,902,947 | 85.1 | % | 83.6 | % | 1.5 | % | 85.4 | % | 84.6 | % | 0.8 | % | 8.97 | 8.89 | 0.9 | % | |||||||||||||||
North Carolina | 12,578 | 1,536,184 | 90.8 | % | 89.4 | % | 1.4 | % | 91.2 | % | 90.2 | % | 1.0 | % | 11.03 | 10.67 | 3.4 | % | |||||||||||||||
Florida | 14,054 | 1,465,494 | 87.5 | % | 88.4 | % | (0.9 | )% | 87.9 | % | 89.2 | % | (1.3 | )% | 15.14 | 14.90 | 1.6 | % | |||||||||||||||
Georgia | 6,861 | 914,949 | 89.6 | % | 89.4 | % | 0.2 | % | 89.3 | % | 91.6 | % | (2.3 | )% | 9.78 | 9.33 | 4.8 | % | |||||||||||||||
Arizona | 8,390 | 983,465 | 85.7 | % | 86.5 | % | (0.8 | )% | 87.2 | % | 88.1 | % | (0.9 | )% | 13.88 | 13.13 | 5.7 | % | |||||||||||||||
Indiana | 7,840 | 1,007,510 | 90.0 | % | 83.7 | % | 6.3 | % | 91.0 | % | 84.1 | % | 6.9 | % | 9.48 | 9.52 | (0.4 | )% | |||||||||||||||
Washington | 4,462 | 557,421 | 83.5 | % | 88.4 | % | (4.9 | )% | 85.6 | % | 89.9 | % | (4.3 | )% | 14.89 | 14.09 | 5.7 | % | |||||||||||||||
Colorado | 4,637 | 564,681 | 87.4 | % | 90.0 | % | (2.6 | )% | 89.2 | % | 91.8 | % | (2.6 | )% | 12.97 | 12.31 | 5.4 | % | |||||||||||||||
Louisiana | 4,520 | 629,928 | 83.4 | % | 83.6 | % | (0.2 | )% | 83.2 | % | 83.8 | % | (0.6 | )% | 10.74 | 10.66 | 0.8 | % | |||||||||||||||
Other(1) | 13,834 | 1,797,307 | 91.0 | % | 89.1 | % | 1.9 | % | 91.9 | % | 89.8 | % | 2.1 | % | 10.92 | 10.43 | 4.7 | % | |||||||||||||||
Total/Weighted Average | 179,977 | 22,833,226 | 87.6 | % | 88.1 | % | (0.5 | )% | 88.4 | % | 88.9 | % | (0.5 | )% | $ | 12.28 | $ | 11.76 | 4.4 | % | |||||||||||||
(1) Other states in NSA's same store portfolio include Alabama, Kentucky, Mississippi, Nevada, New Hampshire, New Mexico, Ohio and South Carolina. | ||||||
Supplemental Schedule 6 (continued) | ||||||||||||||||||||||||||||||||||||||||||||
Same Store Performance Summary | ||||||||||||||||||||||||||||||||||||||||||||
(dollars in thousands, except per square foot data) (unaudited) | ||||||||||||||||||||||||||||||||||||||||||||
Year Ended December 31, 2018 compared to Year Ended December 31, 2017 | ||||||||||||||||||||||||||||||||||||||||||||
Total Revenue | Property Operating Expenses | Net Operating Income | Net Operating Income Margin | |||||||||||||||||||||||||||||||||||||||||
State | Stores | YTD 2018 | YTD 2017 | Growth | YTD 2018 | YTD 2017 | Growth | YTD 2018 | YTD 2017 | Growth | YTD 2018 | YTD 2017 | Growth | |||||||||||||||||||||||||||||||
California | 77 | $ | 73,020 | $ | 68,573 | 6.5 | % | $ | 21,560 | $ | 20,949 | 2.9 | % | $ | 51,460 | $ | 47,624 | 8.1 | % | 70.5 | % | 69.5 | % | 1.0 | % | |||||||||||||||||||
Oregon | 55 | 36,857 | 36,635 | 0.6 | % | 9,918 | 9,620 | 3.1 | % | 26,939 | 27,015 | (0.3 | )% | 73.1 | % | 73.7 | % | (0.6 | )% | |||||||||||||||||||||||||
Texas | 51 | 25,259 | 24,421 | 3.4 | % | 9,489 | 9,421 | 0.7 | % | 15,770 | 15,000 | 5.1 | % | 62.4 | % | 61.4 | % | 1.0 | % | |||||||||||||||||||||||||
Oklahoma | 30 | 14,726 | 14,614 | 0.8 | % | 4,834 | 4,841 | (0.1 | )% | 9,892 | 9,773 | 1.2 | % | 67.2 | % | 66.9 | % | 0.3 | % | |||||||||||||||||||||||||
North Carolina | 28 | 15,796 | 15,208 | 3.9 | % | 5,106 | 4,629 | 10.3 | % | 10,690 | 10,579 | 1.0 | % | 67.7 | % | 69.6 | % | (1.9 | )% | |||||||||||||||||||||||||
Florida | 20 | 19,802 | 18,820 | 5.2 | % | 6,068 | 5,916 | 2.6 | % | 13,734 | 12,904 | 6.4 | % | 69.4 | % | 68.6 | % | 0.8 | % | |||||||||||||||||||||||||
Georgia | 20 | 8,042 | 7,679 | 4.7 | % | 2,966 | 2,821 | 5.1 | % | 5,076 | 4,858 | 4.5 | % | 63.1 | % | 63.3 | % | (0.2 | )% | |||||||||||||||||||||||||
Arizona | 15 | 12,082 | 11,736 | 2.9 | % | 3,584 | 3,573 | 0.3 | % | 8,498 | 8,163 | 4.1 | % | 70.3 | % | 69.6 | % | 0.7 | % | |||||||||||||||||||||||||
Indiana | 14 | 8,712 | 8,370 | 4.1 | % | 2,874 | 3,016 | (4.7 | )% | 5,838 | 5,354 | 9.0 | % | 67.0 | % | 64.0 | % | 3.0 | % | |||||||||||||||||||||||||
Washington | 13 | 7,238 | 7,013 | 3.2 | % | 2,147 | 2,002 | 7.2 | % | 5,091 | 5,011 | 1.6 | % | 70.3 | % | 71.5 | % | (1.2 | )% | |||||||||||||||||||||||||
Colorado | 10 | 6,618 | 6,402 | 3.4 | % | 2,199 | 2,055 | 7.0 | % | 4,419 | 4,347 | 1.7 | % | 66.8 | % | 67.9 | % | (1.1 | )% | |||||||||||||||||||||||||
Louisiana | 10 | 5,731 | 5,722 | 0.2 | % | 2,024 | 2,033 | (0.4 | )% | 3,707 | 3,689 | 0.5 | % | 64.7 | % | 64.5 | % | 0.2 | % | |||||||||||||||||||||||||
Other(1) | 33 | 17,928 | 16,881 | 6.2 | % | 6,822 | 6,700 | 1.8 | % | 11,106 | 10,181 | 9.1 | % | 61.9 | % | 60.3 | % | 1.6 | % | |||||||||||||||||||||||||
Total/Weighted Average | 376 | $ | 251,811 | $ | 242,074 | 4.0 | % | $ | 79,591 | $ | 77,576 | 2.6 | % | $ | 172,220 | $ | 164,498 | 4.7 | % | 68.4 | % | 68.0 | % | 0.4 | % | |||||||||||||||||||
(1) Other states in NSA's same store portfolio include Alabama, Kentucky, Mississippi, Nevada, New Hampshire, New Mexico, Ohio and South Carolina. | ||||||
Supplemental Schedule 6 (continued) | |||||||||||||||||||||||||||||||||
Same Store Performance Summary | |||||||||||||||||||||||||||||||||
(dollars in thousands, except per square foot data) (unaudited) | |||||||||||||||||||||||||||||||||
Year Ended December 31, 2018 compared to Year Ended December 31, 2017 | |||||||||||||||||||||||||||||||||
Rentable Square Feet | Occupancy at Period End | Average Occupancy | Average Annualized Rental Revenue per Occupied Square Foot | ||||||||||||||||||||||||||||||
State | Units | YTD 2018 | YTD 2017 | Growth | YTD 2018 | YTD 2017 | Growth | YTD 2018 | YTD 2017 | Growth | |||||||||||||||||||||||
California | 46,480 | 5,819,811 | 89.1 | % | 90.8 | % | (1.7 | )% | 91.0 | % | 91.1 | % | (0.1 | )% | $ | 13.19 | $ | 12.32 | 7.1 | % | |||||||||||||
Oregon | 22,480 | 2,834,113 | 82.6 | % | 85.9 | % | (3.3 | )% | 86.1 | % | 89.2 | % | (3.1 | )% | 14.82 | 14.28 | 3.8 | % | |||||||||||||||
Texas | 19,966 | 2,819,416 | 88.4 | % | 88.5 | % | (0.1 | )% | 89.6 | % | 88.4 | % | 1.2 | % | 9.74 | 9.55 | 2.0 | % | |||||||||||||||
Oklahoma | 13,875 | 1,902,947 | 85.1 | % | 83.6 | % | 1.5 | % | 85.0 | % | 85.3 | % | (0.3 | )% | 8.85 | 8.76 | 1.0 | % | |||||||||||||||
North Carolina | 12,578 | 1,536,184 | 90.8 | % | 89.4 | % | 1.4 | % | 90.8 | % | 90.7 | % | 0.1 | % | 10.86 | 10.46 | 3.8 | % | |||||||||||||||
Florida | 14,054 | 1,465,494 | 87.5 | % | 88.4 | % | (0.9 | )% | 88.2 | % | 87.4 | % | 0.8 | % | 14.99 | 14.71 | 1.9 | % | |||||||||||||||
Georgia | 6,861 | 914,949 | 89.6 | % | 89.4 | % | 0.2 | % | 89.4 | % | 92.8 | % | (3.4 | )% | 9.62 | 9.12 | 5.5 | % | |||||||||||||||
Arizona | 8,390 | 983,465 | 85.7 | % | 86.5 | % | (0.8 | )% | 88.4 | % | 89.6 | % | (1.2 | )% | 13.45 | 12.84 | 4.8 | % | |||||||||||||||
Indiana | 7,840 | 1,007,510 | 90.0 | % | 83.7 | % | 6.3 | % | 89.1 | % | 84.1 | % | 5.0 | % | 9.46 | 9.64 | (1.9 | )% | |||||||||||||||
Washington | 4,462 | 557,421 | 83.5 | % | 88.4 | % | (4.9 | )% | 87.4 | % | 90.7 | % | (3.3 | )% | 14.56 | 13.67 | 6.5 | % | |||||||||||||||
Colorado | 4,637 | 564,681 | 87.4 | % | 90.0 | % | (2.6 | )% | 90.7 | % | 92.5 | % | (1.8 | )% | 12.63 | 11.97 | 5.5 | % | |||||||||||||||
Louisiana | 4,520 | 629,928 | 83.4 | % | 83.6 | % | (0.2 | )% | 84.1 | % | 84.4 | % | (0.3 | )% | 10.62 | 10.62 | — | ||||||||||||||||
Other(1) | 13,834 | 1,797,307 | 91.0 | % | 89.1 | % | 1.9 | % | 91.2 | % | 89.8 | % | 1.4 | % | 10.66 | 10.19 | 4.6 | % | |||||||||||||||
Total/Weighted Average | 179,977 | 22,833,226 | 87.6 | % | 88.1 | % | (0.5 | )% | 89.0 | % | 89.2 | % | (0.2 | )% | $ | 12.02 | $ | 11.55 | 4.1 | % | |||||||||||||
(1) Other states in NSA's same store portfolio include Alabama, Kentucky, Mississippi, Nevada, New Hampshire, New Mexico, Ohio and South Carolina. | ||||||
Supplemental Schedule 7 | |||||||||||||||
Reconciliation of Same Store Data and Net Operating Income to Net Income | |||||||||||||||
(dollars in thousands) (unaudited) | |||||||||||||||
Three Months Ended December 31, | Year Ended December 31, | ||||||||||||||
2018 | 2017 | 2018 | 2017 | ||||||||||||
Rental revenue | |||||||||||||||
Same store portfolio | $ | 61,978 | $ | 59,440 | $ | 243,781 | $ | 234,321 | |||||||
Non-same store portfolio | 19,848 | 9,661 | 64,622 | 17,493 | |||||||||||
Total rental revenue | 81,826 | 69,101 | 308,403 | 251,814 | |||||||||||
Other property-related revenue | |||||||||||||||
Same store portfolio | 1,973 | 1,916 | 8,030 | 7,753 | |||||||||||
Non-same store portfolio | 653 | 268 | 2,153 | 502 | |||||||||||
Total other property-related revenue | 2,626 | 2,184 | 10,183 | 8,255 | |||||||||||
Property operating expenses | |||||||||||||||
Same store portfolio | 19,878 | 19,484 | 79,591 | 77,576 | |||||||||||
Non-same store portfolio | 7,035 | 3,801 | 24,284 | 6,879 | |||||||||||
Total property operating expenses | 26,913 | 23,285 | 103,875 | 84,455 | |||||||||||
Net operating income | |||||||||||||||
Same store properties | 44,073 | 41,872 | 172,220 | 164,498 | |||||||||||
Non-same store properties | 13,466 | 6,128 | 42,491 | 11,116 | |||||||||||
Total net operating income | 57,539 | 48,000 | 214,711 | 175,614 | |||||||||||
Management fees and other revenue | 4,846 | 2,083 | 12,310 | 8,061 | |||||||||||
General and administrative expenses | (10,606 | ) | (7,994 | ) | (36,220 | ) | (30,060 | ) | |||||||
Depreciation and amortization | (22,921 | ) | (20,169 | ) | (89,147 | ) | (75,115 | ) | |||||||
Income from operations | 28,858 | 21,920 | 101,654 | 78,500 | |||||||||||
Other (expense) income | |||||||||||||||
Interest expense | (11,961 | ) | (9,280 | ) | (42,724 | ) | (34,068 | ) | |||||||
Equity in losses of unconsolidated real estate ventures | (1,713 | ) | (79 | ) | (1,423 | ) | (2,339 | ) | |||||||
Acquisition costs | (192 | ) | (143 | ) | (663 | ) | (593 | ) | |||||||
Non-operating (expense) income | (160 | ) | 17 | (91 | ) | (58 | ) | ||||||||
(Loss) gain on sale of self storage properties | — | (28 | ) | 391 | 5,715 | ||||||||||
Other expense | (14,026 | ) | (9,513 | ) | (44,510 | ) | (31,343 | ) | |||||||
Income before income taxes | 14,832 | 12,407 | 57,144 | 47,157 | |||||||||||
Income tax expense | (349 | ) | (392 | ) | (818 | ) | (1,159 | ) | |||||||
Net income | $ | 14,483 | $ | 12,015 | $ | 56,326 | $ | 45,998 | |||||||
Supplemental Schedule 8 | |||||||||||||||
Selected Financial Information | |||||||||||||||
(in thousands, except per square foot data) (unaudited) | |||||||||||||||
Three Months Ended December 31, | Year Ended December 31, | ||||||||||||||
2018 | 2017 | 2018 | 2017 | ||||||||||||
Average Annualized Rental Revenue Per Occupied Square Foot | |||||||||||||||
Same store | $ | 12.28 | $ | 11.76 | $ | 12.02 | $ | 11.55 | |||||||
Total consolidated portfolio | $ | 12.26 | $ | 11.64 | $ | 11.98 | $ | 11.52 | |||||||
Total Consolidated Portfolio Capital Expenditures | |||||||||||||||
Recurring capital expenditures | $ | 1,971 | $ | 906 | $ | 6,001 | $ | 3,495 | |||||||
Value enhancing capital expenditures | 414 | 1,484 | 3,563 | 2,755 | |||||||||||
Acquisitions capital expenditures | 1,845 | 2,804 | 9,356 | 8,953 | |||||||||||
Total Consolidated Portfolio Capital Expenditures | $ | 4,230 | $ | 5,194 | $ | 18,920 | $ | 15,203 | |||||||
Property Operating Expenses Detail | |||||||||||||||
Store payroll and related costs | $ | 7,645 | $ | 6,750 | $ | 29,518 | $ | 24,590 | |||||||
Property tax expense | 6,749 | 5,558 | 25,692 | 20,283 | |||||||||||
Other property operating expenses | 12,519 | 10,977 | 48,665 | 39,582 | |||||||||||
Property operating expenses on the Company's statements of operations | $ | 26,913 | $ | 23,285 | $ | 103,875 | $ | 84,455 | |||||||
General and Administrative Expenses Detail | |||||||||||||||
Supervisory and administrative expenses | $ | 4,352 | $ | 3,889 | $ | 16,929 | $ | 14,439 | |||||||
Equity-based compensation expense | 1,029 | 920 | 3,837 | 3,764 | |||||||||||
Other general and administrative expenses | 5,225 | 3,185 | 15,454 | 11,857 | |||||||||||
General and administrative expenses on the Company's statements of operations | $ | 10,606 | $ | 7,994 | $ | 36,220 | $ | 30,060 | |||||||
• | EBITDA and Adjusted EBITDA do not reflect the Company's cash expenditures, or future requirements, for capital expenditures, contractual commitments or working capital needs; |
• | EBITDA and Adjusted EBITDA do not reflect the significant interest expense, or the cash requirements necessary to service interest or principal payments, on the Company's debts; |
• | although depreciation and amortization are non-cash charges, the assets being depreciated and amortized will often have to be replaced in the future, and EBITDA and Adjusted EBITDA do not reflect any cash requirements for such replacements; |
• | Adjusted EBITDA excludes equity-based compensation expense, which is and will remain a key element of the Company's overall long-term incentive compensation package, although the Company excludes it as an expense when evaluating its ongoing operating performance for a particular period; |
• | EBITDA and Adjusted EBITDA do not reflect the impact of certain cash charges resulting from matters the Company considers not to be indicative of its ongoing operations; and |
• | other companies in NSA's industry may calculate EBITDA and Adjusted EBITDA differently than NSA does, limiting their usefulness as comparative measures. |
• | NOI is one of the primary measures used by NSA's management and the Company's PROs to evaluate the economic productivity of the Company's properties, including the Company's ability to lease its properties, increase pricing and occupancy and control the Company's property operating expenses; |
• | NOI is widely used in the real estate industry and the self storage industry to measure the performance and value of real estate assets without regard to various items included in net income that do not relate to or are not indicative of operating performance, such as depreciation and amortization, which can vary depending upon accounting methods, the book value of assets, and the impact of NSA's capital structure; and |
• | NSA believes NOI helps the Company's investors to meaningfully compare the results of its operating performance from period to period by removing the impact of the Company's capital structure (primarily interest expense on the Company's outstanding indebtedness) and depreciation of the cost basis of NSA's assets from its operating results. |